
Page 19 - RDS_Postumia_eng
P. 19
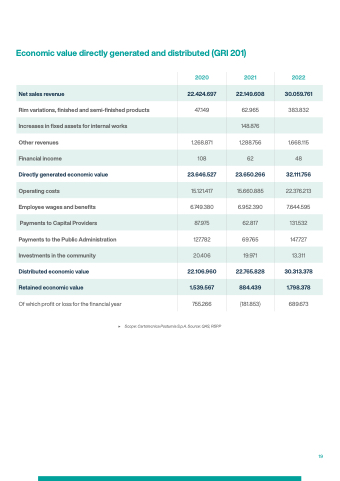
Economic value directly generated and distributed (GRI 201)
2020
2021
2022
383.832
1.668.115
48
32.111.756
22.376.213
7.644.595
131.532
147.727
13.311
30.313.378
689.673
    Net sales revenue
Rim variations, finished and semi-finished products
Other revenues
Directly generated economic value
Employee wages and benefits
Payments to the Public Administration
Distributed economic value
Of which profit or loss for the financial year
▶
Increases in fixed assets for internal works
22.424.697
22.149.608
30.059.761
   47.149
62.965
   148.876
   1.268.871
1.288.756
   Financial income
108
62
   23.646.527
23.650.266
   Operating costs
15.121.417
15.660.885
   6.749.380
6.952.390
   Payments to Capital Providers
87.975
62.817
   127.782
69.765
   Investments in the community
20.406
19.971
   22.106.960
22.765.828
   Retained economic value
1.539.567
884.439
1.798.378
   755.266
Scope: Cartotecnica Postumia S.p.A. Source: QAS, RSPP
(181.853)
19
